SaaS Dashboard / 2023
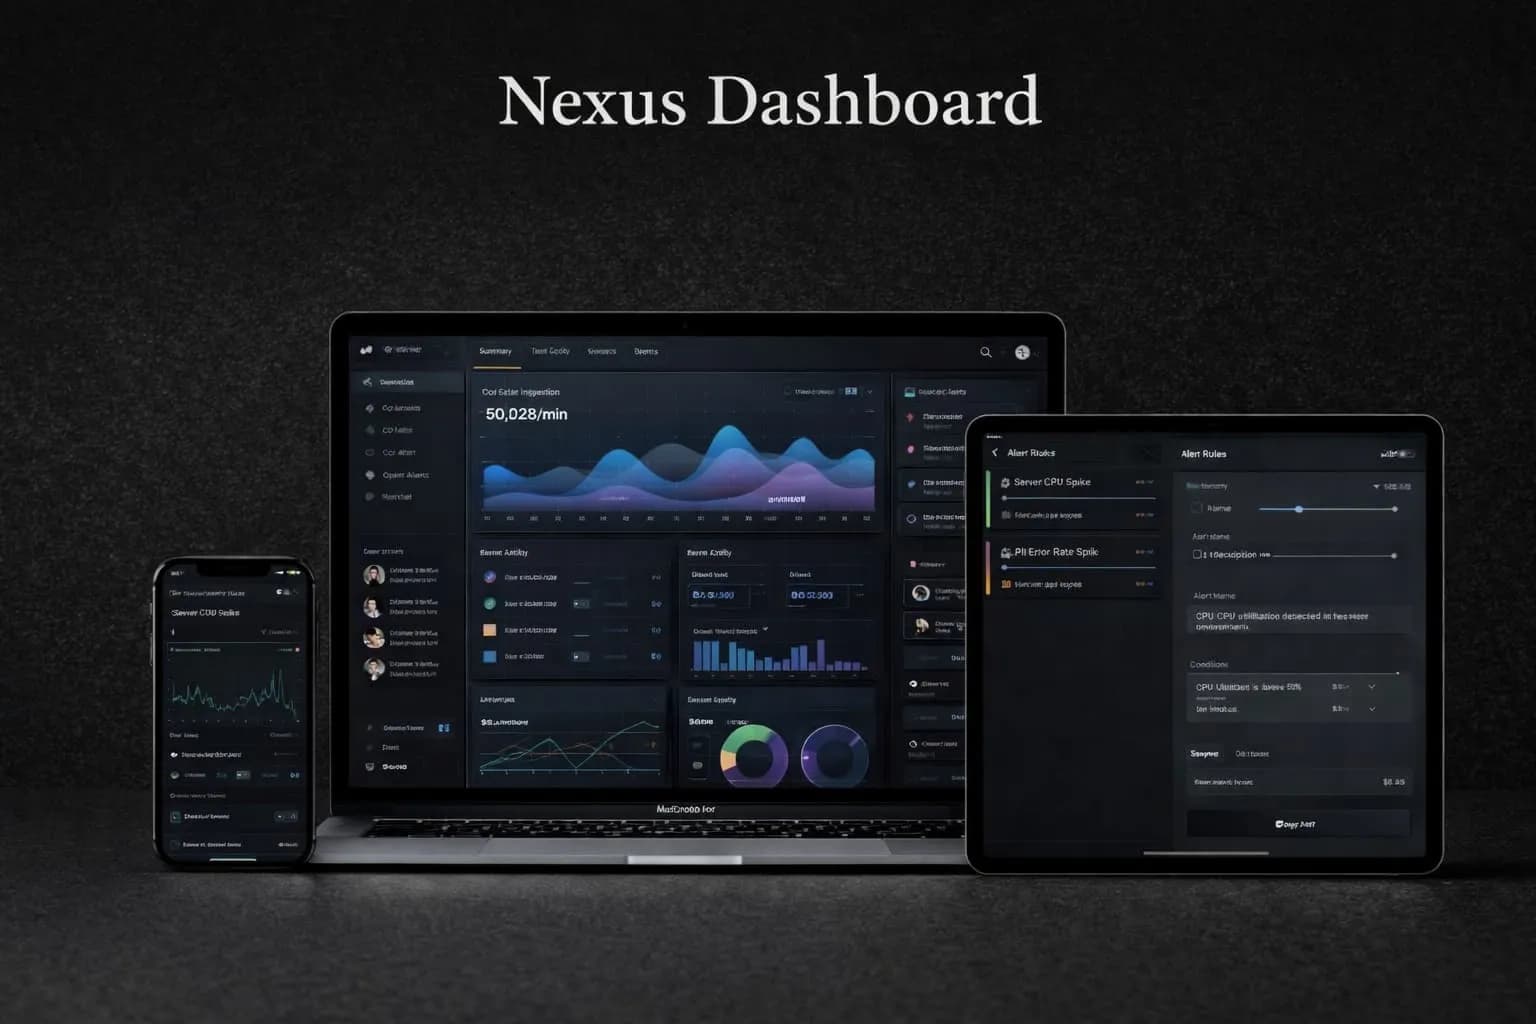
Nexus Dashboard
A real-time analytics dashboard processing 50,000+ events per minute. Live data visualization, custom alert rules, and team collaboration features built for a data infrastructure startup.
The startup had a powerful data pipeline but no way for their customers to interact with it visually. They needed a dashboard that could handle high-frequency data updates without degrading performance or usability.
Designed the data flow architecture first. WebSocket connections deliver events to a client-side buffer that batches updates before hitting the rendering layer. D3.js handles the heavy visualization work while React manages the application shell and user interactions.
D3.js over a charting library
Off-the-shelf chart libraries could not handle the update frequency or the custom visualization types the client needed. D3 gave direct control over the rendering pipeline and allowed us to optimize for specific data patterns.
Client-side event buffering
Rather than rendering every WebSocket event immediately, events accumulate in a 100ms buffer and flush as a batch. This prevents DOM thrashing at high throughput while keeping the visual update cadence smooth enough to feel real-time.
Handles 50K events per minute with sub-200ms visual latency. The client used the dashboard as a core differentiator in their Series A pitch.
React
Application shell, routing, and state management for collaborative features.
Node.js
WebSocket server and event processing middleware.
D3.js
Custom high-performance visualizations that no charting library could deliver.
WebSocket
Bi-directional real-time communication for live event streaming and alert triggers.